The Ultimate Power BI Guide for SMBs
This is a comprehensive business guide to Power BI, which helps SMBs grow at scale by transforming complex data into interactive reports, predictive analysis, AI-driven insights, and much more.
So, if you want to drive smarter data-driven business decisions, this guide is for you. Let's start your digital transformation journey here.


The Ultimate Power BI Guide for SMBs (2025)
Data is everywhere, but you need the right tool to extract it.
Artificial intelligence (AI) and business intelligence (BI) are the tools that are helping businesses to collect and make use of digital customer data. Data management and consumption is a constant challenge for businesses, but with the help of AI and BI, they can form useful insights from the data they collect.
Businesses do understand the need to visually understand and utilise the data. This would force them to use technology to make data-driven and technology-driven decisions in order to achieve rapid growth.
Modern organisations accept the fact that data analysis and visualisation are the keys to predicting market and competitor behaviour, customer changing requirements, product profitability, and taking rewarding decisions.
According to the most recent statistics, data analysis and visualisation make decisions for small, medium, and large businesses 5X faster and more efficient.

In today's digital world, business Intelligence plays a vital role in helping organisations assemble, integrate, visualize, and analyse unorganised data to make smarter and more informed decisions. The digital transformation of customers is pushing industries to rely totally on data for a sustainable and profitable business.
As per report, 7 out of 10 Businesses rate finding data as very crucial. (Source)

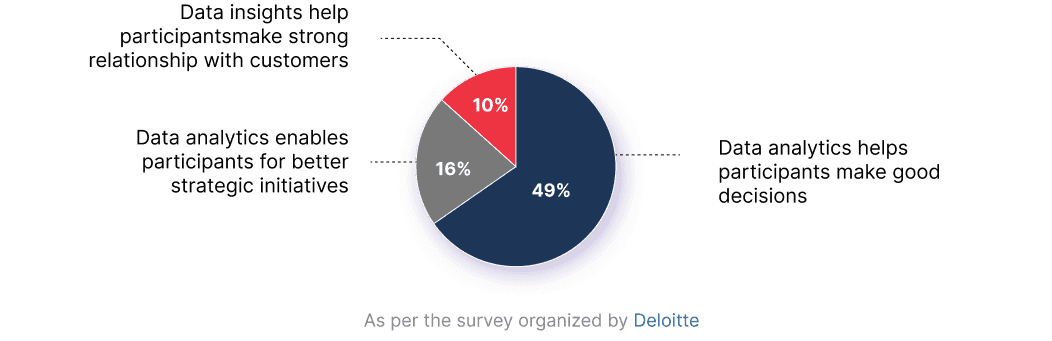
As per the survey organized by Deloitte(Source)
- 49% of participants agree that data analytics helps them make good decisions.
- 16% admits that data enables them for better strategic initiatives.
- 10% agrees that data insights help them make strong relationship with customers.
To stay ahead of the competition, industries must follow the data trends. If we talk about top 3 business intelligence trends of 2022, they are:
- Data Visualisation
- Data Quality Management
- Self-Service Business Intelligence

You probably agree with the above statistics but might be wondering about the methods and applications to use the data and make it work for your business.
Microsoft Power BI is a business intelligence application that allows organisations to visualise and report a pile of data on a single dashboard in a ready-to-use manner. With the capabilities of presentation, distribution, and integration, it is one of Microsoft's products that is a must-have for today's businesses, whether small or large.
Power BI enables the organisation to track customers as well as competitors using available metrics, whether demographics, age, or the number of sales.
Power BI can be the steppingstone of your business to become successful by extracting the useful insights from your data.
Want to know how?
If yes, this Power BI user guide is for the people like you who want to explore the possibilities and opportunities of a data-driven business growth.
Chapter 1 Introduction to Power BI
In this chapter, we will get to know about the history,
architecture, and components of Power BI.


History of Power BI
The concept of Power BI was originally designed by Ron George with the name “Project Crescent.” Amir Netz and Thierry D'Hers were the ones who fabricated this innovative application.
On July 2011, Project Crescent was available free to download for the public, combined with the SQL Server Codename Denali.
In September 2013, Project Crescent was renamed Power BI by Microsoft as Power BI for Office 365. It was the first version of Power BI based on Microsoft Excel with add-ons such as Power Pivot, Power Query, and Power View.
With time, Microsoft keeps updating this application with new features and functions, like enterprise-level data connectivity, a question and answer panel, and security updates.
From July 24, 2015, Microsoft Power BI was available to download for the general public with different versions of web, desktop, and mobile apps.

Overview:
Microsoft Power BI is a business intelligence solution that allows users to analyse the data, visualise the reports, and share the true insights within the organisation.
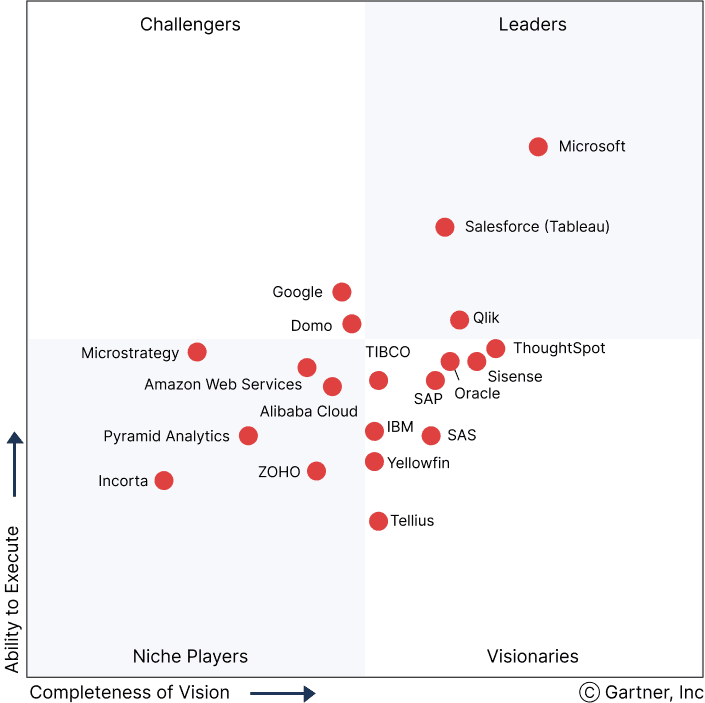
As per the 2022 Gartner Magic Quadrant for Analytics and Business Intelligence Platforms, Microsoft is awarded as a leader for the 15th consecutive year in the industry based on Ability to Execute and Completeness of Vision.
Power BI collects the data from different sources, visualises, and shows it on a single interactive dashboard to get accurate intelligence reports to make actionable decisions.
Power BI eliminates the use of multiple applications to execute and consume the data for the advancement of the organisation. It even reduces the cost, complexity, and security risks of data management using secured cloud servers from Microsoft Azure.
Power BI uses AI and ML to mine data for useful insights and create simple yet stunning visualisations to help users make informed and analytical decisions.
US businesses lose $100 billion every year due to data inaccuracy. (Source)

Power BI uses Microsoft Azure servers as cloud storage to keep the data safe and secure using end-to-end encryption, sensitivity labelling, and real-time access monitoring.
As per the reports, 71% of businesses opt for Microsoft Azure as their number one vendor.(Source)
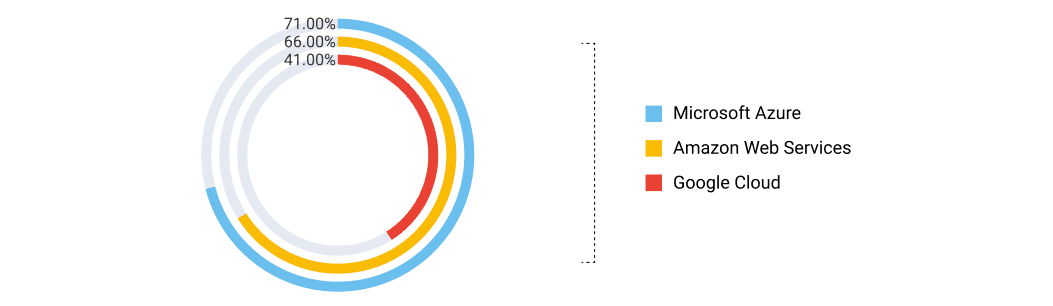
Microsoft Azure is the most preferred cloud BI provider by enterprises as of 2020. 71% of users considered it as either critical or very important to their operations. Microsoft Azure is followed by Amazon Web Services and Google Cloud, with 66% and 41% of users finding them critical or very important to their business, respectively. (Dresner, 2020)
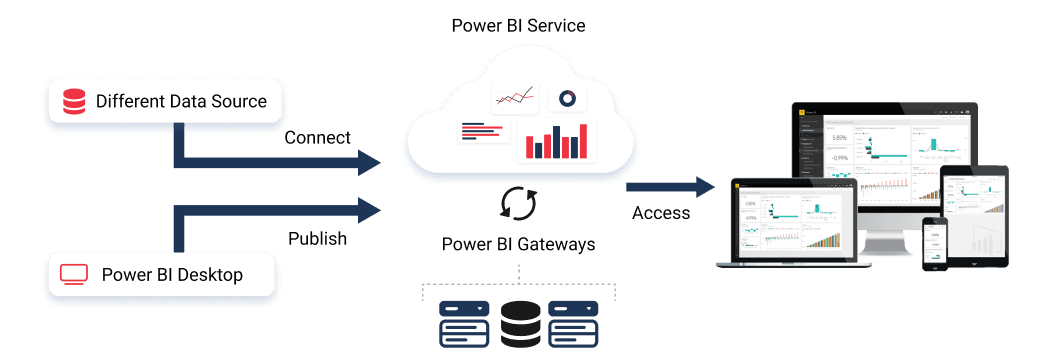
Architecture of Power BI
Power BI is a powerful yet simple business intelligence tool that lets users create and share effective reports to gain meaningful insights and efficient actions.
Understanding Power BI architecture would help you understand how it works and how it processes the data collected using different resources.
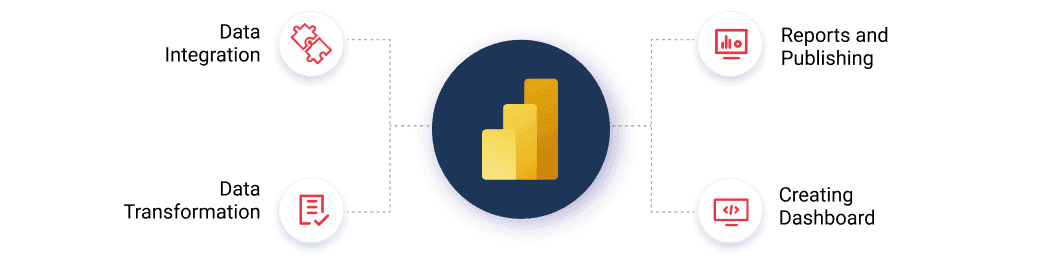
There are 4 steps in Power BI architecture, which are:
- Data Integration
Power BI extracts data from different sources and in different formats. If the size of the data is below 1 GB, it will be compressed and stored automatically.
If the size of the data exceeds 1 GB, it uses a direct query, integrates it into a standard format, and stores it in the staging area.
- Data Transformation
The stored data is in raw form and cannot be visualised directly. It should be processed or cleaned before being transformed for visualisation.
Pre-processing of Data: The removal of missing values from the raw data is known as preprocessing.
Post-Processing of Data: The standard rules are applied to transform the data from raw to processed form.
Once the pre and post-processing are complete, the data stored is moved to the data warehouse with full safety.
- Reporting and Publishing
After data processing, reports can be created to visualise the data and get important insights.
There are various ways data can be consumed, like graphs, charts, slicers, bars, and more.
Once the process of data creation is complete, it can be published to any component of Power BI, whether Power BI Services or Power BI Desktop.
- Creating Dashboards
Using the individual elements of Power BI, users can create dashboards after producing reports.
Now, users can extract data from the visuals shown on the dashboard, making the data easy to access and use.
Also, Power BI allows users to communicate with live visuals using filters.
Components of Power BI
Power BI is one of the powerful data analytics tools for organisations, whether small or large. It provides seamless data visualisation and reporting to the users, helping them serve the organisation as well as the customers better. There are various components that help the users to achieve such exceptional outcomes.
- Power Query
Power Query is a data transformation engine that enables users to find, refine, connect, and combine various data resources. It is capable of reading different database formats, like Oracle, MySQL, SQL Server, and more.
It comes as a part of Power BI Desktop and can be integrated with Excel for better data visualisation. - Power Pivot
Power Pivot is a data modelling engine that allows users to build data models, share true insights, manage relationships, and execute proper calculations.
Power Pivot is a bit different function that runs on DAX (Data Analysis Expression) to execute simple as well as complex data. - Power View
Power View is the function responsible for the filtration and presentation of data in a simple-to-visualize manner, like charts, graphs, bars, and more, by connecting different data sources.
It is a kind of standard feature of Microsoft, available in Power BI, Excel, SQL Server, and SharePoint. - Power Map
Power Maps works collaboratively with Bing Maps to offer 3-D data visualisation and mapping on Power BI and Excel.
It uses various factors, like latitude, longitude, street address, city, state, and country, to present the data in 3D format. - Power BI Desktop
Power BI Desktop is the core development application used to develop the components of Power BI, like Power Query, Power View, and Power Pivot.
It also allows the user to create the BI report and make any necessary changes to the data process. - Power BI Website
The Power BI Website is specifically built for small and medium-sized businesses, where they can publish the data directly on Power BI website using a web browser.
- Power Q&A
The Power Q&A function allows users to directly search the data or any query using their natural language.
This makes finding the data easier just by asking in simple words as compared to manually searching the pile of files for the exact data a user is looking for.


Chapter 2Power BI Features and Benefits
In this chapter, we will get to know the top features and benefits of Power BI.

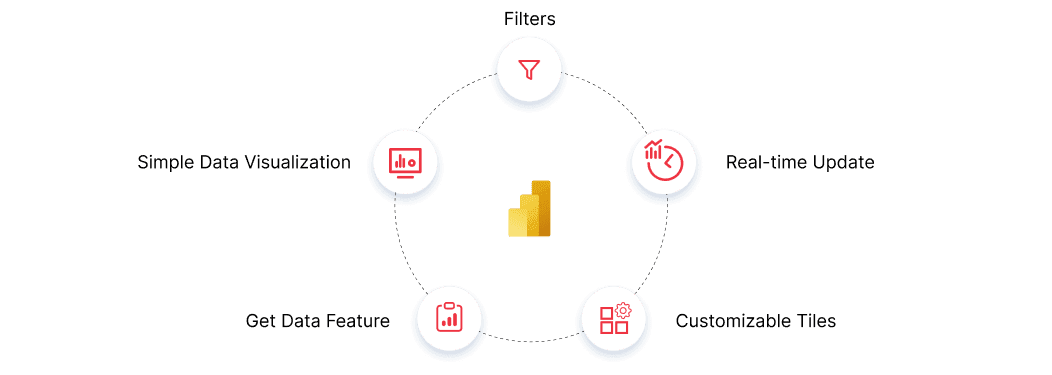
Top 5 Features of Power BI:
1. Simple Data Visualisation
Power BI provides compelling data visualisation of complex data irrespective of the size and format of raw data.
Sometimes, the standard visualisation format isn't capable enough to provide the user with the exact data they are looking for. In such a case, users can access customised visualisation templates to transform complex data into a simpler form.
2. Get Data Feature
The "Get Data" feature is a smart function that allows users to build reports and dashboards without writing queries.
This feature of Power BI lets users establish a connection with the organisation's database, whether it is SQL or Oracle, in real-time.
3. Real-time Update
There is a feature in Power BI that lets the users refresh or update their database automatically in real time.
This makes the organisation save time and money while automating the data update process irrespective of the server location they are using, whether cloud or on-premises.
4. Filters
The filter feature of Power BI lets you arrange the important columns or data of a file by disabling the not-so-important data or hiding it.
Users are capable of separating the data based on their requirements at a particular point in time. Thereafter, users can create a chart based on visible data, choosing the irrelevant values to opt out of.
5. Customizable Tiles
Power BI is a flexible application that allows users to customise and get more out of it. Such customizations enable users to shortlist the data, change tile placements, and adjust the columns for more data consumption. Also, Power BI enables users to customise the viewpoints of tiles to increase the overall productivity and efficiency of the application.
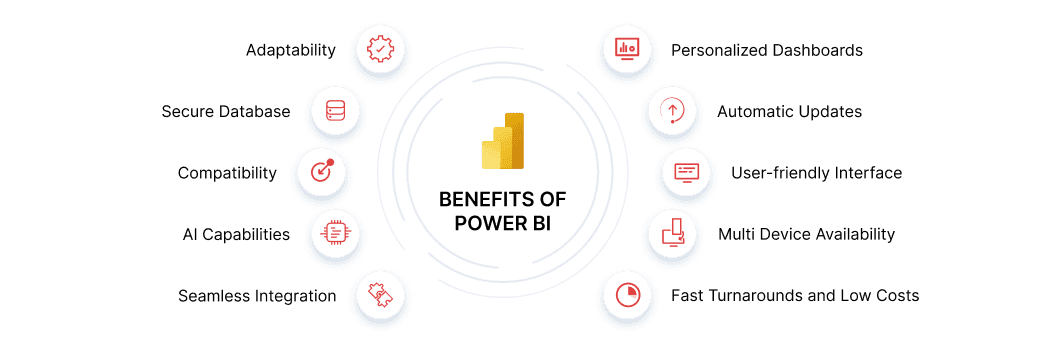
Benefits of Power BI
Being a most convenient business analytics tool, Power BI offers various benefits to users, making it the first choice for SMBs:
1. Adaptability
One of the best things about Power BI is its adaptability for all business types and different company sizes.
Power BI allows industries to increase or decrease the capabilities of Power BI using the cloud as per their revenue, needs, and growth.
2. Secure Database
Due to cloud storage, Microsoft Power BI offers immense security to the organisation's data with its secured servers hosted on Microsoft Azure.
Power BI offers rich visibility, cyber threat safety servers, secured data transaction flow, data encryption, and more such features to its cloud users.
3. Compatibility
For good visualisation capabilities, a BI tool must be compatible with accepting data from different sources to show true insights.
As we have discussed earlier, Power BI is compatible with fetching data from different sources and in different file formats. Once the data collection process is complete, it executes the data and presents the visualisations.
4. AI Capabilities
The AI (artificial intelligence) of Power BI helps to fill the values gaps in data to make it workable for accurate and complete visualisations.
AI lets the users show and find more actionable data to transform into visualisations.
5. Seamless Integration
Users can integrate native or third-party applications with Power BI, making the process of data analysis and visualisation a lot smoother.
Tools like Excel, Azure, Microsoft Cloud App Security, Office 365, and more are available to enhance efficiency and productivity.
6. Personalized Reporting and Dashboards
A personalised dashboard makes the data reporting easy to access as well as easy to use. Users can customise the dashboard as per their requirements and make Power BI work for them.
7. Automatic Updates
Microsoft releases Power BI updates twice a year, making it equipped with the latest features and functions to tackle complex processes.
organisations don't have to be concerned about installing updates as Microsoft will automatically process the updates without hampering any processes or operations.
8. User-friendly Interface
Power BI provides an easy-to-understand and simple user interface to decrease the chances of missing even the minute details of data visualization.
Also, Microsoft Power BI provides an easy-to-navigate user interface so that all the features and tools are easily accessible to all users.
9. Multi Device Availability
Power BI provides a multi-channel experience to the users where they can access the data using different devices, whether mobile, desktop, or web, and from anywhere in the world.
Users can analyse and visualise the data in real time, making the business available 24/7.
10. Fast Turnarounds and Low Costs
With real-time data updates, users can analyse the data and make informed and actionable decisions to improve business efficiency.
Also, the users can track the processes and operations that have an issue or are not performing as per expectations to make the necessary changes for good.
Images of below Cases (Manufacturing / Trading / Top business category audience)

Chapter 3Power BI Dashboards
The Power BI Dashboards are a single-page visualisation feature that shows the data using graphs and charts as a highlight of the reports

The Power BI Dashboards are a single-page visualisation feature that shows the data using graphs and charts as a highlight of the reports. Dashboards, also known as "Canvas," are only available for creation in the Power BI Service. However, you can view and share the dashboards using designated apps on mobile devices.
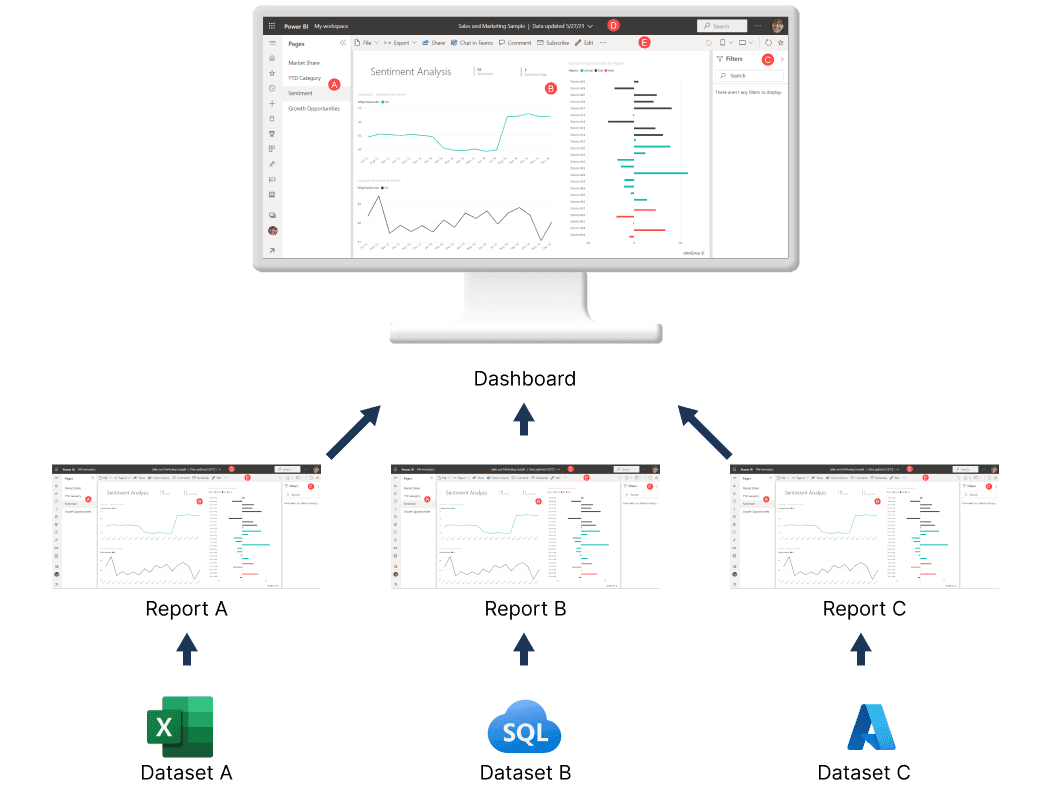
On the dashboards, different visualisations are available based on different data sources, known as tiles. To view a particular tile of a report on the dashboards, you need to 'pin' it.
A set of data forms a dataset, and a report is created based on the available data in a dataset. These report datasets are visualised on dashboards to make the data easily accessible to the end user.
Power BI Dashboards can revolutionise how data visualisation is used in an organisation, whether manually or using other BI tools. Using the technology of machine learning, artificial intelligence, and cloud computing, Microsoft Power BI makes data consumption so simple that organisations get superior in performing better for customers and growing at a high pace.
Advantages of Power BI Dashboards:
Microsoft Power BI Dashboards are an amazing feature and do offer a lot of advantages to users and organisations:
- A user can share the dashboard with the team or other employees of the organisation instantly and get the remarks for a particular task.
- Power BI Dashboards are so flexible that they can be embedded into any native or third-party application to make the data visualization experience smoother.
- Dashboards are easy to personalise and customise as per your requirements and can be reset to default whenever required.
- A Power BI Dashboard allows users to create and show visualizations from multiple datasets and reports.
- The Power BI Dashboard enables users to view and analyse the reports along with important data metrics on a single screen and with ease.
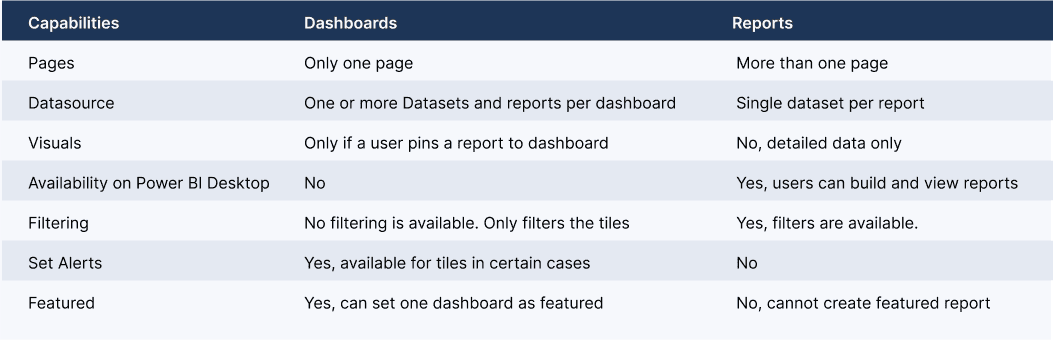
Power BI Dashboards Vs. Reports
Power BI Dashboard is meant to summarize the data visualisation, whereas reports are intended to show a detailed representation of the data.
Also, the Power BI shows the visual representation of the data briefly, and on the other hand, reports show the detailed version of the data as per the organisation's standard.
How to Create a Dashboard in Power BI?
Till now, you would have had sound knowledge of dashboards, reports, tiles, and more. You probably want to create a dashboard to check how these things work and how Power BI shows the data visualisation.
Generally, there are different methods to create a dashboard, like using an existing report, using a dataset, duplicating an existing dashboard, or creating a dashboard from scratch.
In this method, we will import Power BI sample datasets and create a new dashboard for learning purposes.
Below, we have given an Excel workbook sample data with two PowerView sheets to import. A report and a dataset will be automatically added to the workspace after importing the data.
- Click to download the Procurement Analysis Sample Excel file. We recommend you upload or save this file on your OneDrive for Business, making it easier to access for later use.
- Open the web browser and open Power BI Service by entering this link - app.powerbi.com
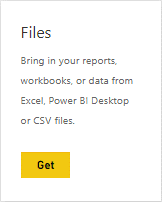
- Open the Navigation panel on the left of the screen and click on the My Workspace button following the Get Data button to import the recently downloaded file. See below picture for reference.
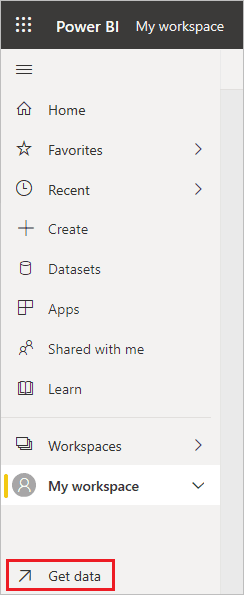
- Once you click on the “Get Data” button, a new File pop-up will display on the screen where you need to click on the Get button to import the data. See the below picture for reference:
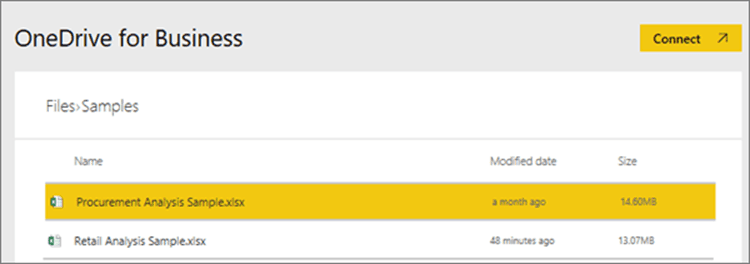
- The OneDrive for Business will open where you need to locate the file we have downloaded, as shown below.
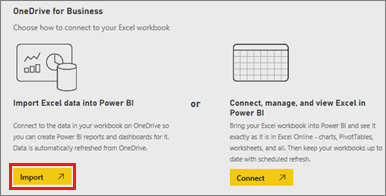
- Click on the file, and a new window open where you need to click on Import button to start importing the file; as shown below:
- Once the file import is complete, a success message will be displayed. You can close it to proceed.

Till now, the process of importing the report data has been completed. The report data has been created, and you can pin the entire report page to the dashboard. The steps to do so are given below:
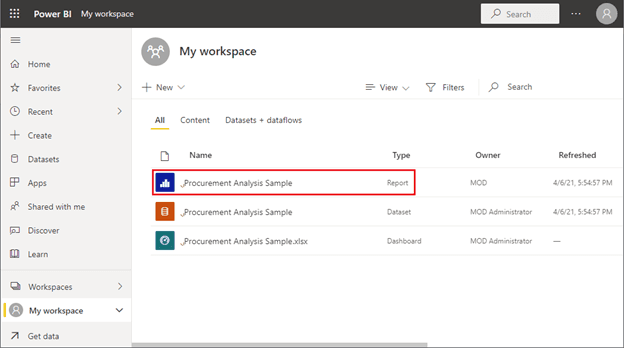
1. In the Workspace, select the Procurement Analysis Sample report as shown below:
2. The report will open in a reading view where you can analyse and visualise the data.
3. On the left of the screen, you can see the two tabs, Discount Analysis and Spend Overview. Each of these tabs shows the specific data of report.
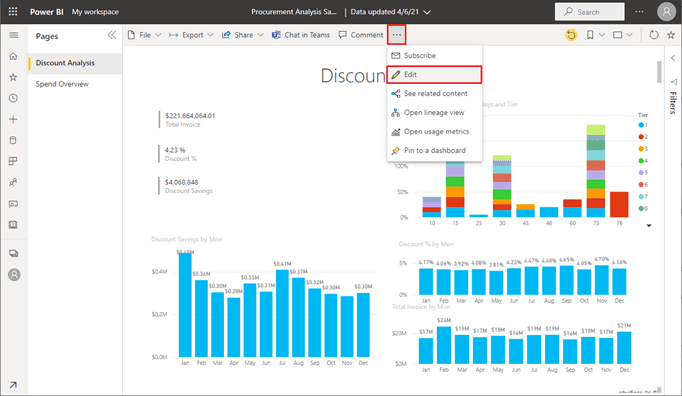
4. In the report editor, click on the Spend Overview tab to open another page of the same report; as shown below:

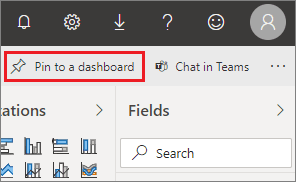
5. To view all the visuals of the report, select Pin to Dashboard button available in upper-right corner of the menu bar; as shown below.
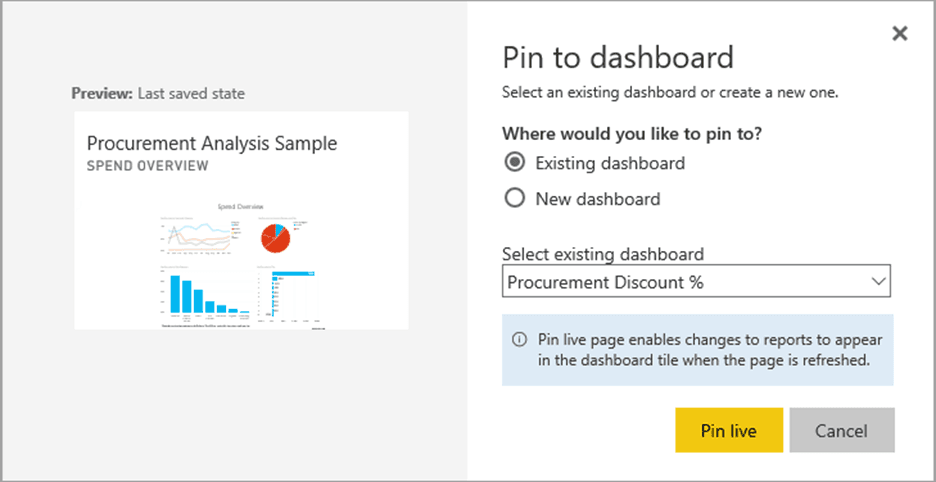
6. Once you click on the Pin to dashboard button, the respected window will appear on the screen where you need to select the Existing Dashboard option and click on the Pin Live button.
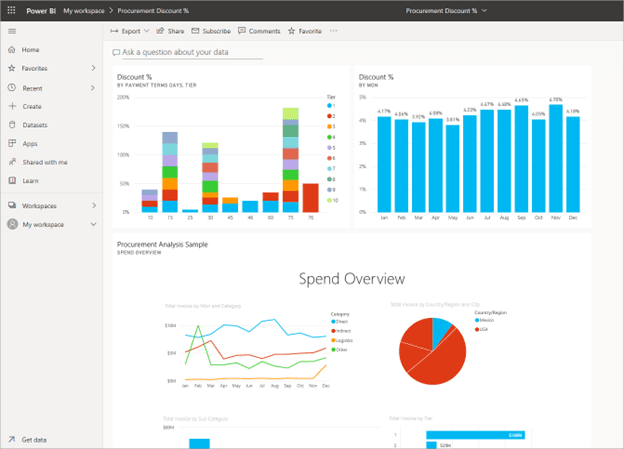
7. A success message will be displayed; after that, you need to click the Go to Dashboard button.
8. On the dashboard, you will see the visualisations of data fetched from the report. Check out the below picture:
Power BI Dashboard Examples
Users can create different kinds of Power BI dashboards as per the data feed in the reports, whether the report belongs to the finance or marketing department.
In this section, you will get to know more Power BI dashboards examples and their need in an organisation:
- Finance Dashboard
- HR Dashboard
- Logistics Dashboard
- Sales Dashboard
- Marketing Dashboard
Finance Dashboard
The Finance Dashboard contains the organisation's financial data in a presentable manner for executive-level employees. This dashboard lets the users scan and analyse the reports using accurate insights per the report's available data.
The purpose of the Financial Dashboard is to provide an overview of the organisation's financial performance. Also, it allows the users to visualise the data as per product or service category and the end users' location to determine the areas of low and high performance.
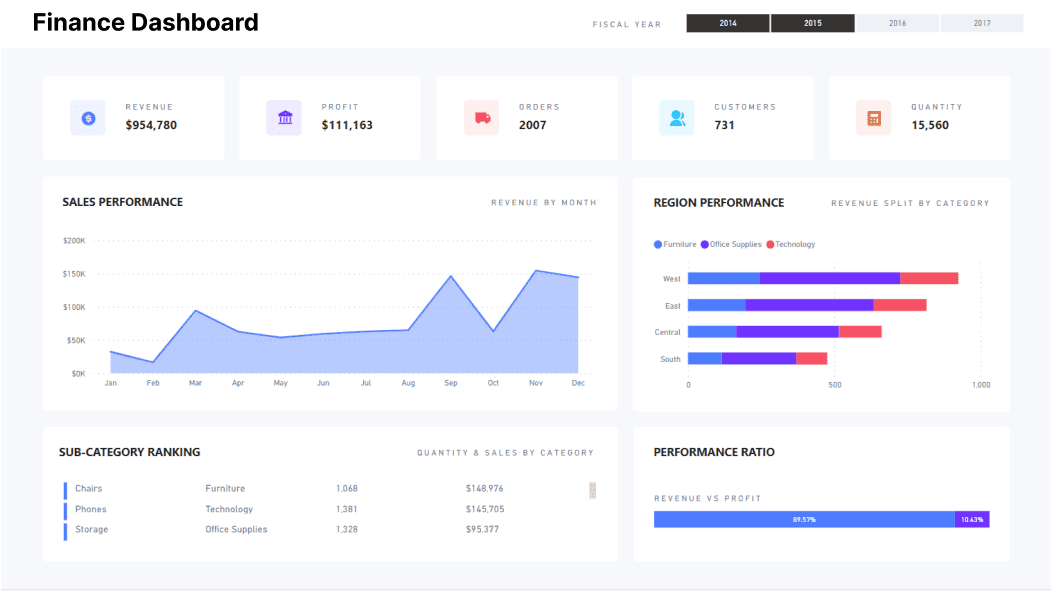
Key Insights of Financial Dashboards:
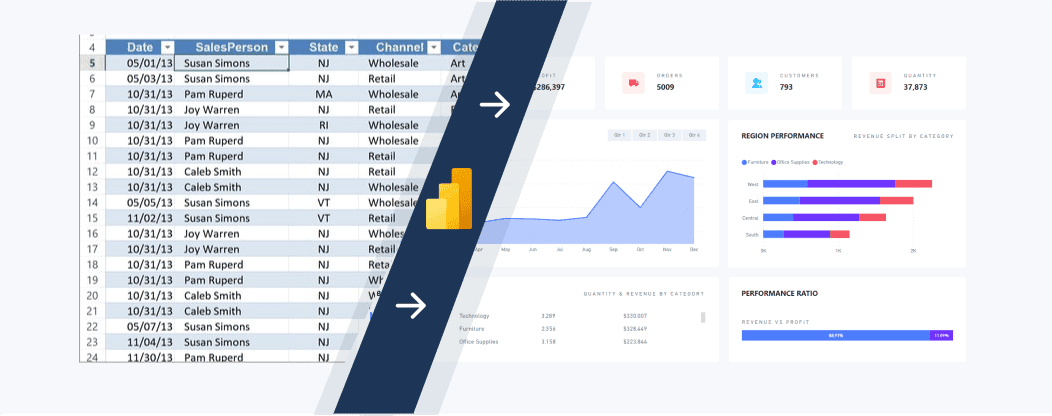
- Key Performance Indicators (KPIs): Shows data of Customers, Revenue, Orders, Quantity, Profits.
- Time Duration or Area Chart: Shows revenue of previous months (12).
- Bar Chart: Shows revenue by Region and Product category.
- Table: Shows performance of each Category and Sub-category.
- 100% Stacked Bar Chart: Shows exact ration of total Revenue to Profit.
HR Dashboard
The HR Dashboard of Power BI is for HR managers to track the performance of their employees, understand demographics, and track new employees.
The purpose of the HR Dashboard is to measure the various parameters of the employees, like salary, work hours, age, attendance, leaves, and more.
The Power BI HR dashboard allows HR to investigate the employees' insights and make the workplace more efficient and productive.
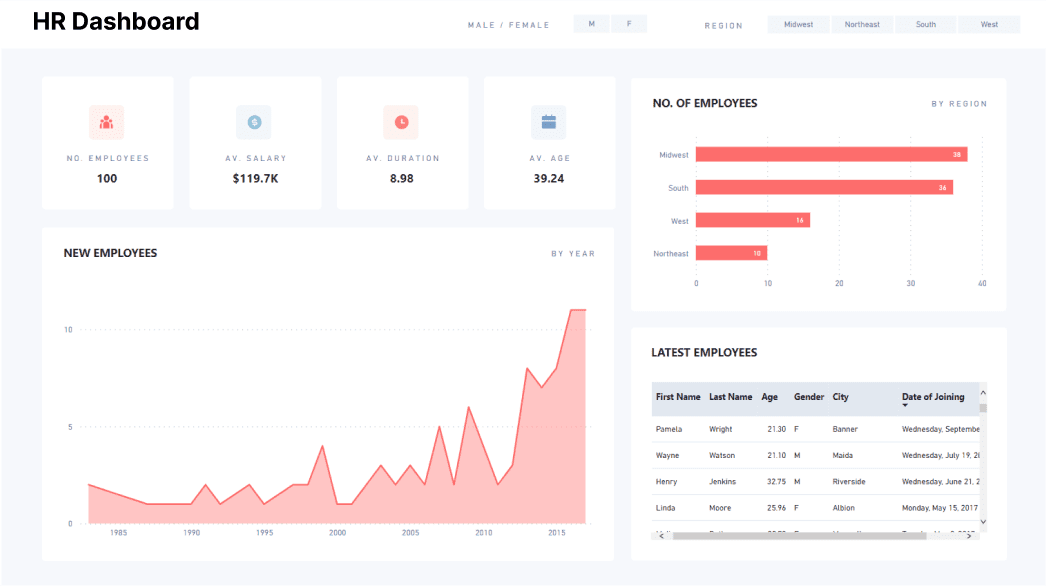
Key Insights of HR Dashboard
- Key Performance Indicators (KPIs): Shows the total no. of employees, and age, term period, and salary to understand the average employees' profile.
- Recruit Charts: Displays new employees of the organisation
- Bar Chart: Displays employees geographically
- Table: Tracks new and old employees.
Logistics Dashboard:
The Power BI Logistics Dashboard is for users like logistics managers, who have to track the flow of goods using different parameters, like mode of delivery, product, category, location, and more.
The purpose of the Power BI Logistics Dashboard is to check and maintain the delivery flow. Also, the dashboard helps the managers identify the weaker logistics section and provides the necessary resources to fill the gap or meet the delivery timeline.
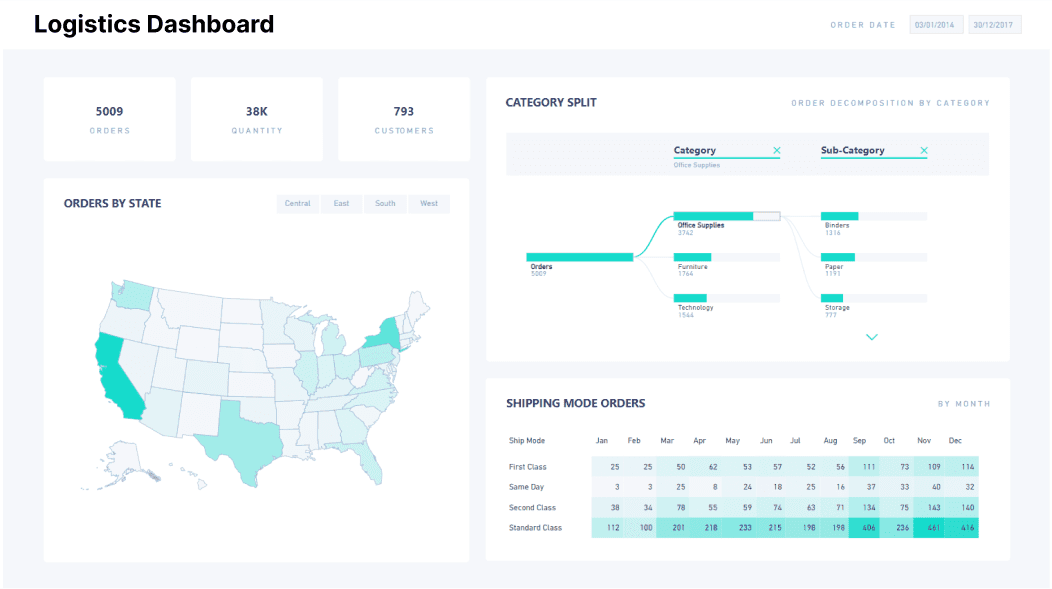
Key Insights of Logistics Dashboards:
- Key Performance Indicators (KPIs): Shows the total number of orders, customers, and product quantity.
- Order Flow: Displays products category and sub-category to arrange as per priority.
- Shape Map: Shows product orders by state to help users assign resources as per need.
- Matrix: Displays orders by time and shipping mode.
Sales Dashboard
The Powe BI Sales dashboard is for users, like sales managers, who have to visualize the data based on sales data, count, opportunity, and more.
The purpose of the sales dashboard is to evaluate the sales data, measure the sales performance, and track the low-performing areas to put more effort into achieving the sales target.
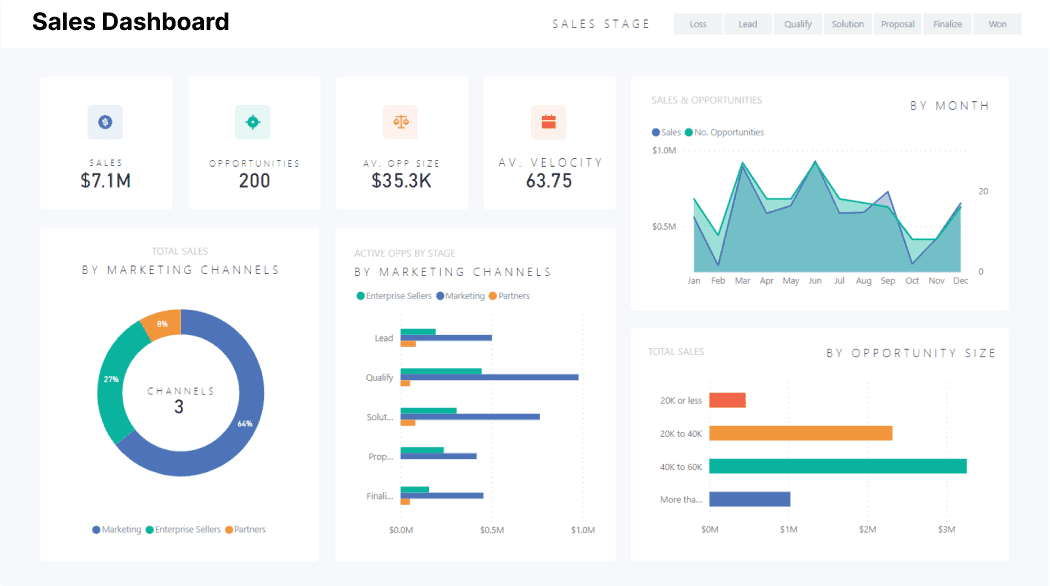
Key Insights of Sales Dashboard:
- Key Performance Indicators (KPIs): It displays the total number of sales, opportunities and their size, as well as average sales velocity, so you can get an overview of current sales status.
- Area Chart: Displays sales and opportunities by time (monthly / annually).
- Donut Chart: It displays the total number of sales classified by marketing channel and assists in focusing more effort on weaker marketing platforms.
- Bar Chart: It shows sales based on sales stage, sales opportunities, and marketing platform.
Marketing Dashboard
The Power BI Marketing Dashboard allows marketers to visualise customer marketing research and campaigns.
The purpose of this dashboard is to research the market trends and patterns per customer and their needs. Such data visualisation helps marketers better understand the customers and provide them with the best service or solution.
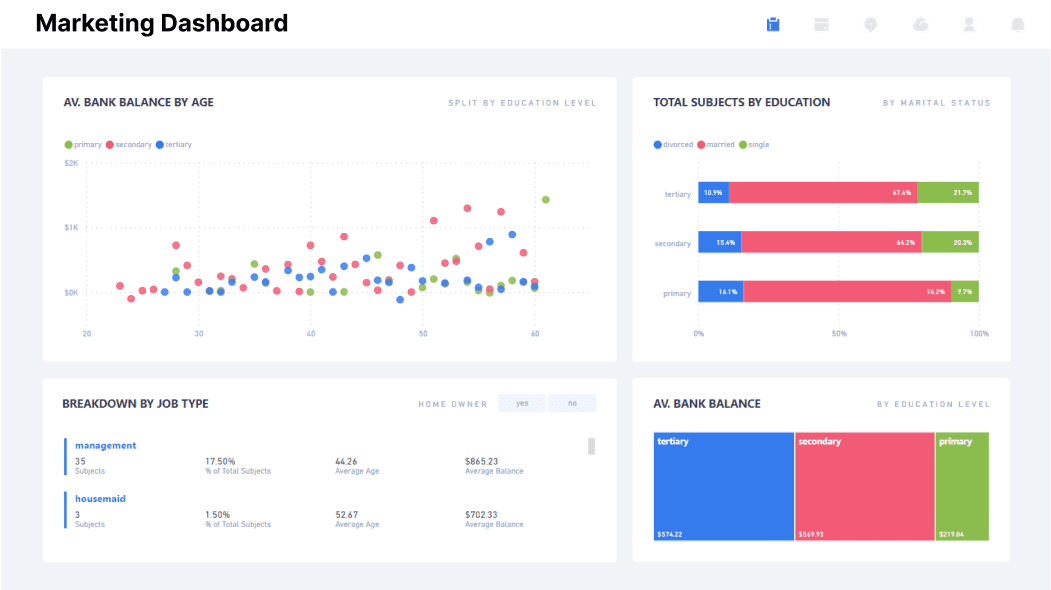
Key Insights of Marketing Dashboard:
- Scatterplot: Displays average bank balance and level of education by age to show the more engaged customers with the organisation.
- 100% Stacked Bar Chart: Shows the education and marital status of the customer to understand the demographics.
- Multi-Card Row: Displays the job profile to better understand the customer's portfolio.
- Treemap: Displays the customer based on education level to identify the potential customer for future reference.
Health Industry Used Cases
Case 1 : Humana, a USA-based health insurance company, has condensed 47 data sources and other business intelligence tools into a robust solution: Microsoft Power BI. They realise creating a dashboard is a quick and easy task. Even the visualisations available on dashboards are easy to understand and update in real-time to make informed decisions about their implementation strategies.
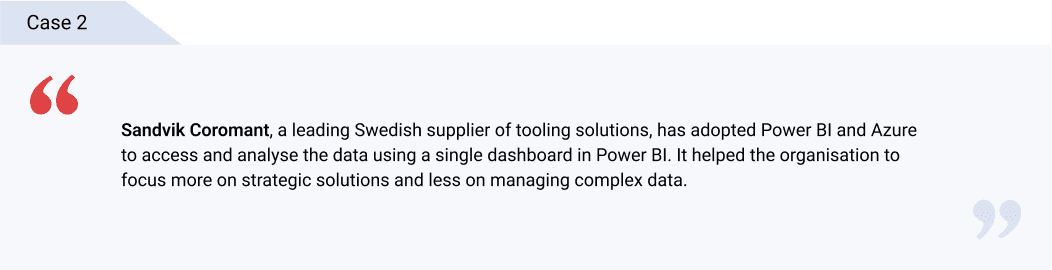
Case 2 : Bayer, the world's largest life science organisation, has implemented Power BI as a one-stop solution for all the data and information they gather from different sources. The Power BI Dashboard has become a game-changer feature for them to visualise tones of data on a single screen. It helped the higher management, like the CFO, to supervise all the datasets and reports of the business from a single screen and share the same with other board members.
Power BI for Finance Industry Use Cases
Finance - Case 1 : Zurich Insurance Group, an insurance solution provider, has implemented Power BI BI to eliminate the data silos and build an efficient data visualization platform. Power BI replaced the time used to gather and extract data with analyzing it for more results and growth. Power BI enables thousands of users to interact and create personalized dashboards based on different aspects of the business. The organisation uses the dashboard to gain insights and focus efforts on the organisation's weaker areas.
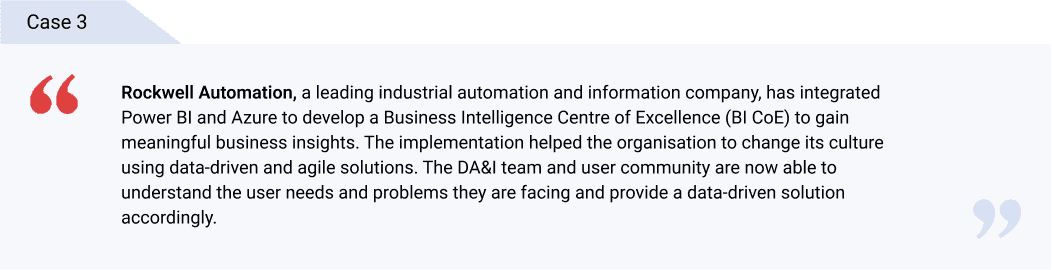
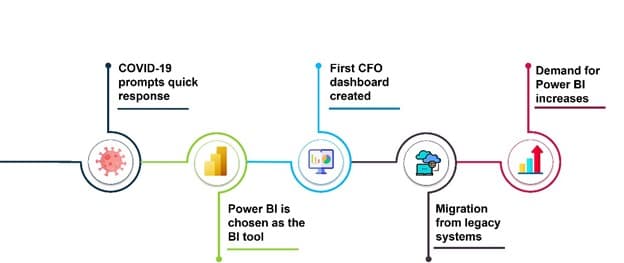
Finance - Case 2: PwC, the world's largest accounting firm, has implemented Azure and Power BI to provide real-time and useful insights. The DIA (Deals, Insights, and Analytics team) realized that most of their clients already use Power BI for simple and quick visualisations. They found Power BI dashboards to be an easy way to create and share valuable insights with the clients throughout the deal and acquisition process.
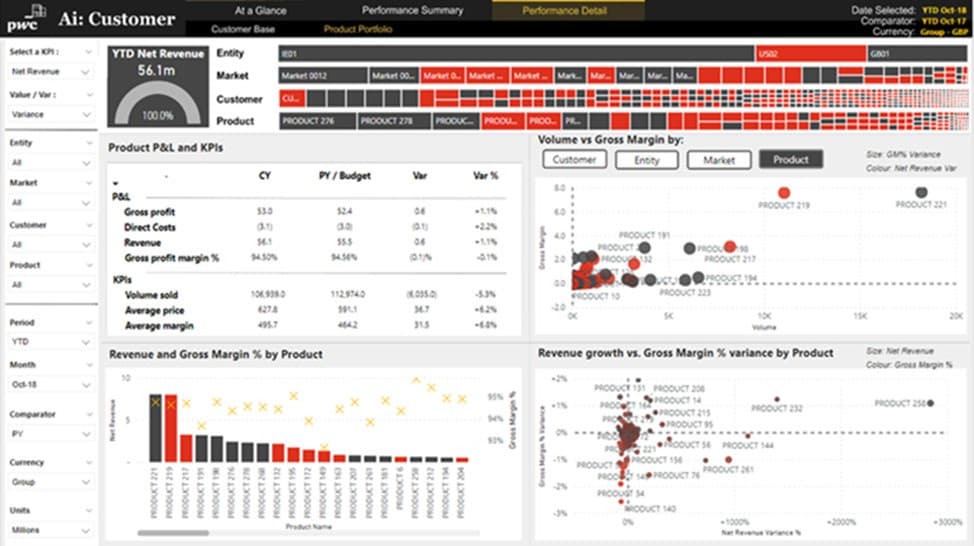
Such custom dashboards help bringing valuable insights to the clients.
Systems and Digital Solution Providers
Case 1 : Johnson Controls is a 136-year-old company working to improve building performance, sustainability, safety, and more using systems and digital solutions. The Power BI dashboards allow users to analyse and review the execution efforts to improve their current system.
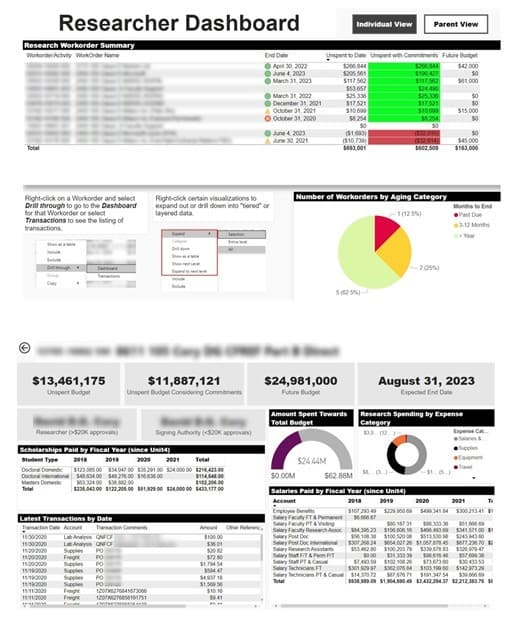
Case 2 : The University of Waterloo implemented Azure and Power BI to decentralise the institution. This allows various types of users to create customised reports and dashboards, such as campus-specific dashboards for business users, public dashboards for students, researcher dashboards for university researchers, device tracking dashboards to count the number of people, and more.
Chapter 4Power BI Integration
This chapter will get you in-depth information about the need of integrations and their benefits.

Power BI supports several native as well as third-party integrations to enhance the capabilities of overall business management.
Power BI Integration with Dynamics 365
The combination of Power BI with Dynamics 365 makes the organisation prepared for the ways of modern business. Dynamics 365 is a business management application that collects and manages data from different departments. In contrast, Power BI combines the data, transforms it into reports, and shows the data visualisations on dashboards to make informed decisions.
Need for Power BI and Dynamics 365 Integration
There are numerous reasons to integrate Power BI with Dynamics 365 to make data-driven decisions and seamless sales processes.
- Supporting the features and capabilities of each other, Power BI and Dynamics 365 support each other, making them compatible for overall data analysis and visualisation.
- The combination helps the sales department to get real-time data-driven insights and take actionable decisions whenever required.
Top Benefits of Power BI and Dynamics 365 Integration
- The combination of these two powerful applications enhances the functionality of business intelligence and helps users implement informed decisionsbased on true data insights. Both Microsoft applications improve operational speeds, reduce the likelihood of errors, enhance the customer experience, and provide valuable insights to the sales team.
- It allows users to create real-time reports to make actionable decisions to improve any process or operation.
- Organisations can know more about their customers using various parameters, age or demographics. This data lets the team offer a more personalised offer and respond to the queries accordingly.
- Using the latest technologies of AI, ML, and cloud, the data captured from Dynamics 365 is easy to analyse and visualise in Power BI with an easy-to-understand data structure.
- An organisation can customise the dashboard based on different types of data received from Dynamics 365 to make the data accessible in Power BI.
Power BI Integration with other Apps
Power BI allows a variety of apps to connect with itself to make the process seamless. The different integrations let the business run efficiently by converting complex processes into simple ones. Organisations can connect native and third-party apps with Power BI, like Salesforce, Microsoft Dynamics, Google Analytics, and more.
Once you connect or integrate the app with Power BI, a separate workspace will be created along with the dashboard where a user can view and visualise the data fetched from the integrated apps.
Chapter 5Power BI Versions, Pricing, and Licensing
In this chapter, you will get to know about the different versions of Power BI, along with their pricing and licensing.

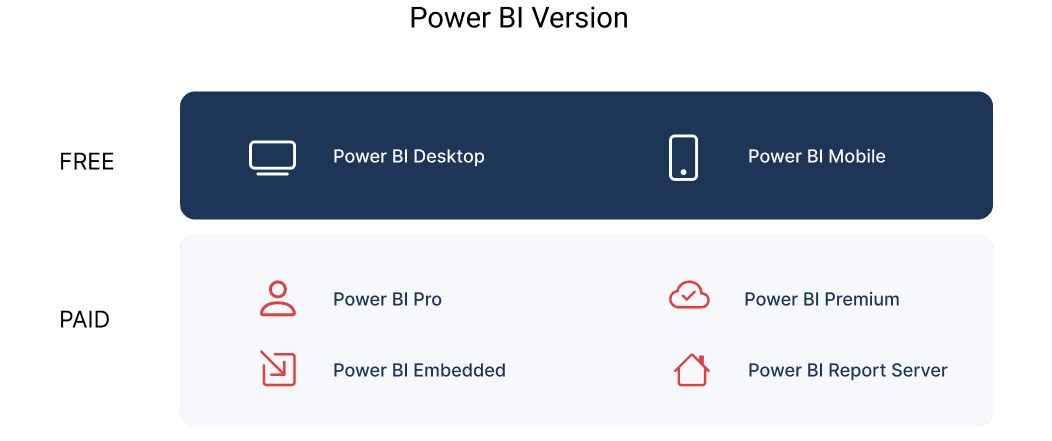
Power BI Versions
Various Power BI versions are available for users based on budget, requirements, and deployment mode.
As per the required features and capabilities, a user can choose the best-suited version depending on the business and its operations.
Power BI Desktop
The Power BI Desktop is the free version that allows users to create and model data reports with creative visualisation. It allows the flexibility to publicly save and publish the visualised file with others using the Power BI web portal. But a user cannot share the file directly with the team members, as this feature only comes in the paid version. The Power BI Desktop comes with Office 365 and can be accessed anytime.
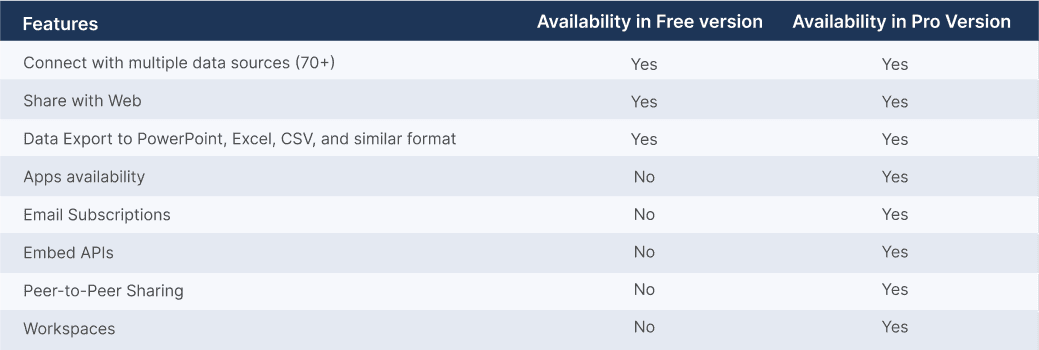
The features of Power BI Desktop are similar to the paid version of Power BI:
- Allows connecting as many data sources as possible.
- Get 10 GB storage to store files or data in cloud servers but can upload a max of 1 GB per upload.
- Power BI will automatically organise the data.
- Users are allowed to create unlimited data visualisation.
- Can export and report data to Excel.
- Complete access to Power BI's visualisations template gallery.
- Allows the users to refresh reports up to 8 times per day.
Power BI Service
Power BI Service is the full or paid version with the data centre hosted on the cloud (Microsoft Azure) that allows users to access reports and dashboards anytime and from anywhere. The Power BI Service can be accessed after purchasing a licence for any of these subversions:
- Power BI Pro
The features and capabilities of Power BI Pro are almost similar to Power BI Desktop, whether it's about data upload size or visualisation options.
However, it comes with additional capabilities:
- Users can share the data or collaborate privately with other Power BI licence users.
- Allows integration with other apps of Microsoft, like Azure.
- Users can link the data visualisation in Power BI apps.
- Crete app workspaces for better team collaboration to show reports and dashboards easily.
- Power BI Premium
Power BI Premium is less a licence and more an allotted amount of dedicated computing storage to access the capabilities of Power BI. It is suitable for small businesses with 100 TB of data storage and a 50 GB limit on dataset size. It is meant for enterprise-level businesses with an enormous amount of data and requires uninterrupted access to use the capabilities of Power BI.
It eliminates the requirement to purchase a licence for each user and lets the organisation purchase the dedicated space and processing capacity for a business to process the reports, dashboards, collaboration, and more of Power BI. Not all the features of Power BI Pro come with Power BI Premium.
If there is a need to create and share reports, collaborate with other team members in the app, and share dashboards, a user will need a Power BI licence for this version to access the core features.
- Power BI Mobile
Power BI Mobile is a native mobile app to let users connect with the data. This app is available for all platforms, whether iOS, Windows, or Android.
The Power BI Mobile app is safe and secure and provides real-time access to reports and dashboards irrespective of the server location.
Power BI Mobile is a handy version of Power BI Desktop where users can do almost every task they are supposed to do on the desktop, whether it is sharing reports or submitting queries.
- Power BI Report Server
Not all industries prefer cloud-based servers, and the reason can be anything, from lack of infrastructure to unreliable data regulation laws to lack of connectivity.
Power BI Report Server is for industries that prefer on-premises server deployment rather than deploying their servers on the cloud and still want an open way to move out to the cloud whenever they are ready.
The Power BI Report Server has nearly identical features and functions to the Power BI service. Users must use the Power BI Desktop app to utilise the functions and can work without an internet connection.
The drawback of using Power BI Report Server is the absence of important features, like no real-time data connectivity, no access to app dashboards, no workspaces, no integration with Excel, and more.
Unlike cloud-based solutions, which release new updates and features monthly, Microsoft releases them every four months.
- Power BI Embedded
As the name suggests, Power BI Embedded allows third-party vendors to embed the features and capabilities of Power BI into their native apps or solutions.
Such vendors have to pay-per-use to Microsoft rather than buy user licences.
This integration helps such vendors implement the features or functions of Power BI without building or updating their solutions.
Power BI Embedded is so convenient for the vendors that the end users will not even know that a particular feature belongs to Power BI.
Power BI - Pricing and Licensing
Power BI is one of the best business intelligence tools available on the market. It provides excellent and powerful data visualisation tools and affordable pricing and licensing plans for all SMBs.This section will give you sound knowledge of Power BI pricing and licensing, along with their capabilities.
Power BI Desktop and Power BI Mobile
Per User/Month
Free / $0
Users can create quick insights, understand the data, and share the visualization using Power BI web portal.
- Comes with Office 365 to streamline the data processing and visualization.
Power BI Pro
Per User/Month
$13.70
license Power BI Pro individual for modern analytics with data visualizations.
- It comes with Live Dashboards and real-time reports to share data with other users.
- Power BI Pro comes with Microsoft Dynamics 365 E5 (business management solution for enterprises)
- Available to buy now with a credit card.
Power BI Premium
Per User/Month
$27.50
Licence Power BI Premium (Per User) to accelerate data visualisation with advanced AI, simple data management, and access at enterprise scale as well as access to self-service data.
- Comes with all the features of Power BI Pro
- Available to buy now with a credit card
Power BI Premium Per Capacity
Per Capacity/Month
$6,858.10
Licence Power BI Premium (Per User) to accelerate data visualisations with advanced AI, simple data management, and access at enterprise scale as well as access to self-service data, but without per-user licence for content consumers.
- To publish content into Power BI Premium capacity, a user requires a Power BI Pro licence.
- Users can enable autoscale feature with Azure subscription to automatically scale Power BI Premium Capacity.
Power BI for non-profit
Microsoft is keen to work for the non-profit organisations and offer various discounts and grants. In this section, you will get the pricing and licensing plans for non-profits organisations.
Power BI Desktop
Grant
Enables the organisation to connect and collect data from hundreds of external sources, build customise visualisations, publish on Power BI Services, and embed the dashboard on any website.
Power BI Pro
Per User/Month
$3
Come with all the features of Power BI Desktop along with additional features, like real-time data update, data collaboration, access governance, and content distribution.
Power BI Premium
Capacity Pricing Per Node/Month
Comes with all features of Power BI Pro along with additional features, like ability to publish reports, offer more capacity as required, content distribution, and embed content on web without purchasing any user licence.
Power BI Embedded Pricing
The pricing of Power BI Embedded is different when we compare it with the pricing of Power BI Pro or Premium.
Generally, the pricing of Power BI Embedded is based on each render, a kind of user activity. When a user loads a page with data visualisations, interacting or refreshing it for real-time data updates counts as one render.
The total cost of rendering depends on the selection of a "node" a user chooses to use on a pay-as-you-go basis. Power BI embedded offers a range of products depending on the processing power to process the data. A node is the connection point that connects the system with the network. The power or processing power of the node is directly proportional to the cost to the user. The higher the power, the more expensive the node.
A1 Node:
The A1 node has 3 GB of RAM and can process 300 renders per hour. The cost it carries is $1.0081 per hour.
A4 Node:
The A4 node comes with 25 GB of RAM and can process 4800 renders per hour. It costs $8.0565 per hour.
This is the hourly rate for a user who can use Power BI Embedded without incurring any upfront or termination fees.
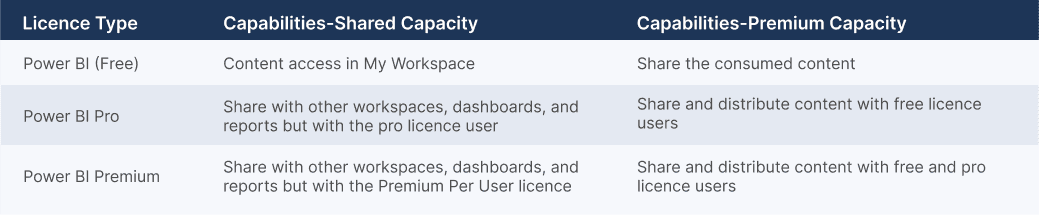
The Basis Capabilities of Each Licence Type:
Chapter 6Power BI vs. Competitors
In this chapter, we are going to compare the features and capabilities of Power BI with other Business Intelligence tools.

Microsoft Power BI isn't the only data visualisation tool available in the market. Various tools compete with Power BI side by side, like:
- Tableau
- QlikView
- Looker
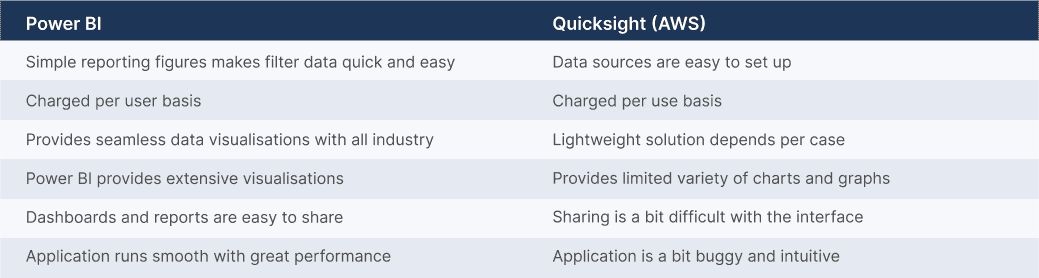
- Quicksight (AWS)
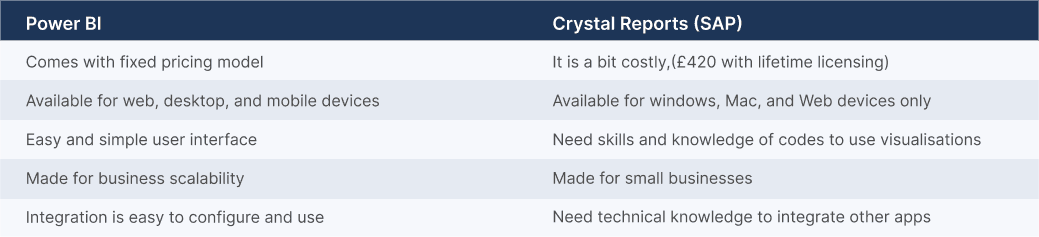
- Crystal Reports (SAP)
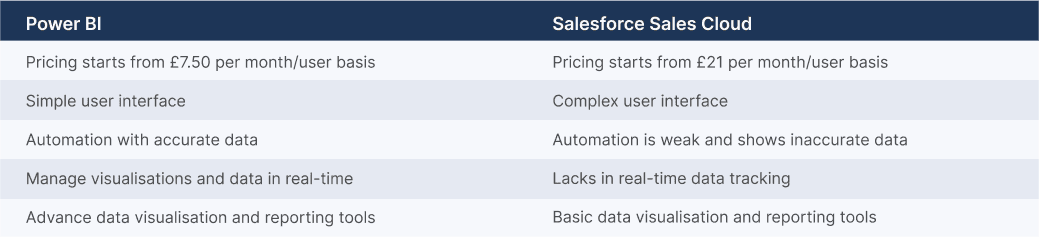
- Salesforce
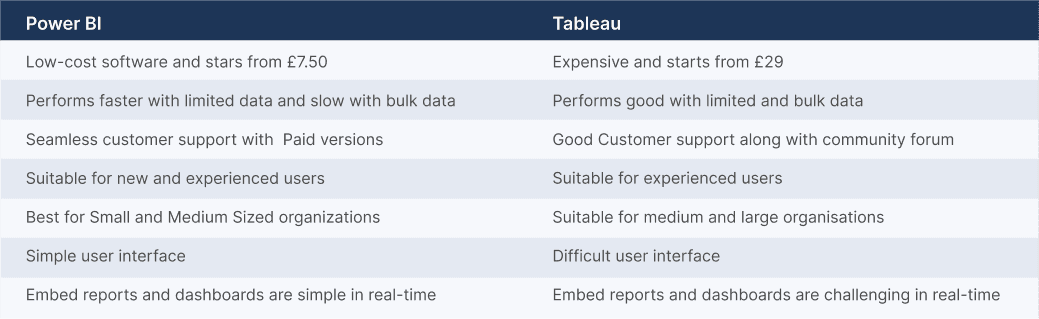
Power BI vs. Tableau
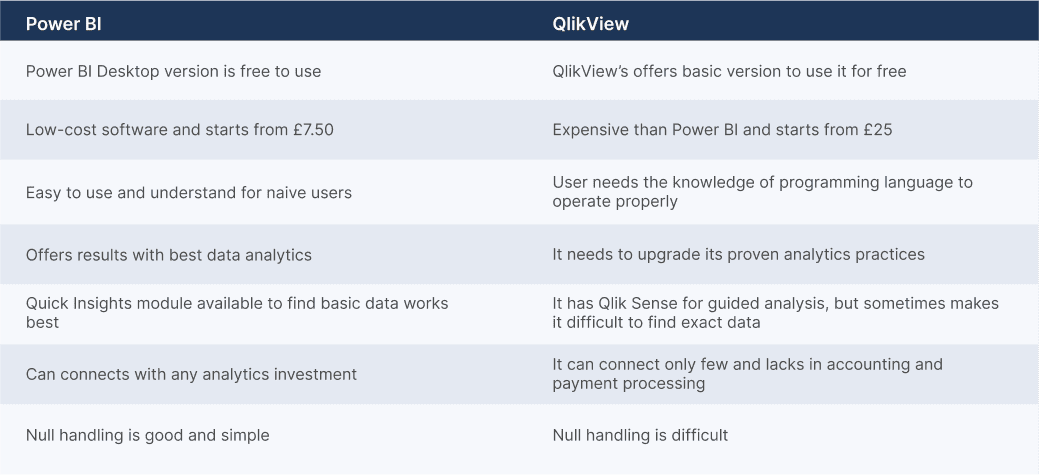
Power BI vs. QlikView
Qlik is an older product launched in 1993 for converting complex data into visualisation.
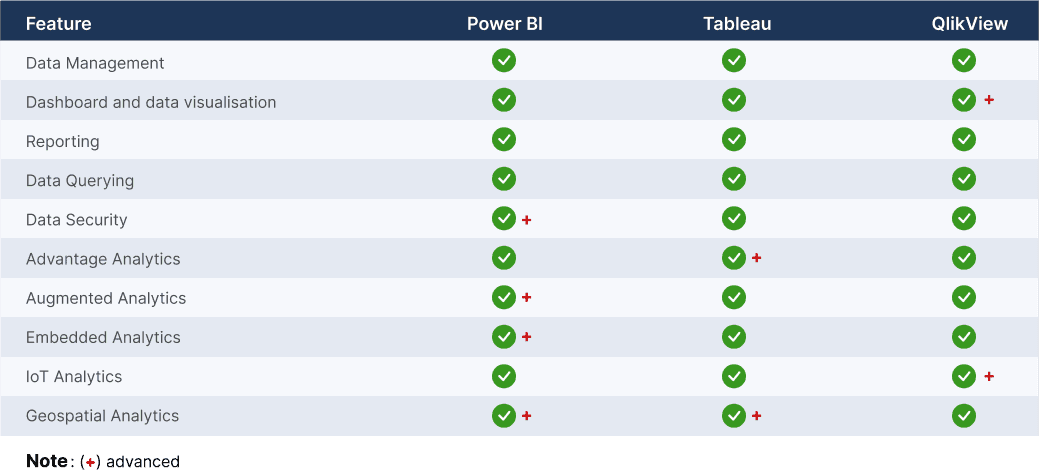
Power BI vs. Tableau vs. Qlikview
Which is better Tableau or Power BI or QlikView? Let's compare them below:
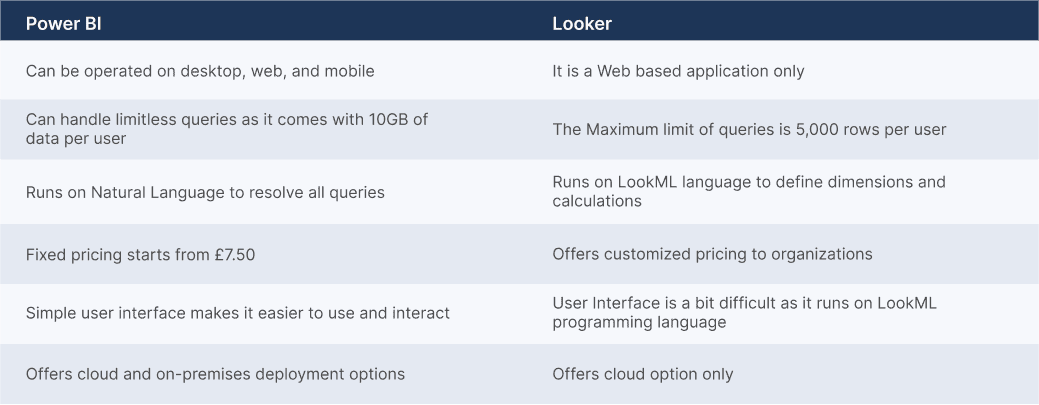
Power BI vs. Looker
Power BI vs. Quicksight (AWS)
Power BI vs. Crystal reports (SAP)
Power BI vs. Salesforce Sales Cloud
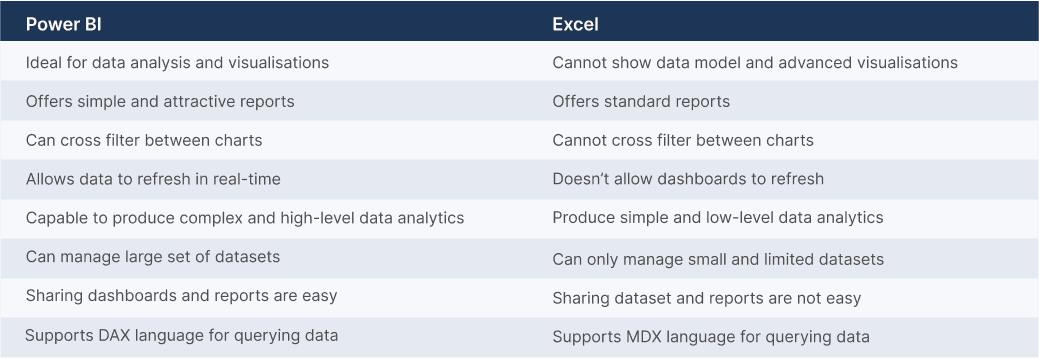
Power BI vs. Excel
Chapter 7Future Scope of Power BI
In this chapter, you will get to know the future scope of Power BI and how it will transform the ways of data data visualisations.

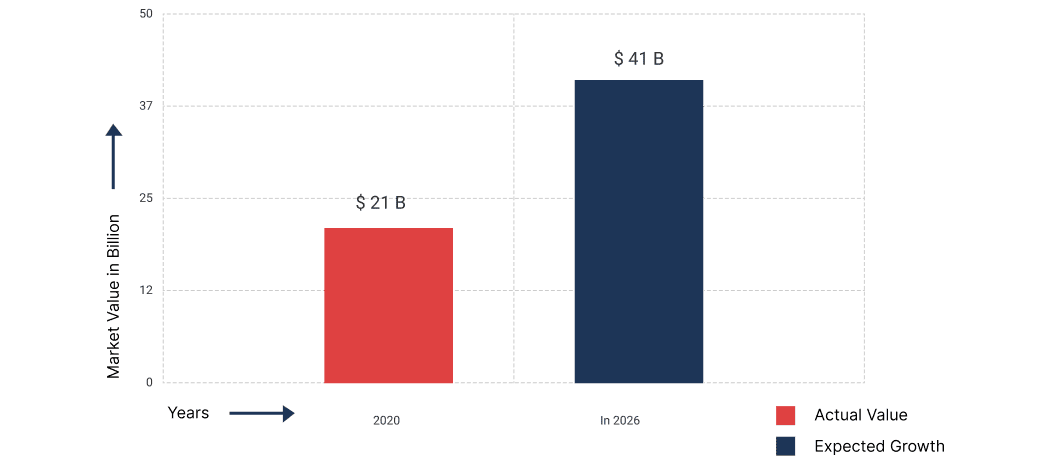
In 2020, the business intelligence market is valued at $21 billion and is expected to increase to $41 billion at a 12% CAGR by 2026.
All businesses, whether small or large, are using data science and data analytics to get actionable insights and make data-driven decisions. Utilizing the data defines the future of the business.
Power BI is one such tool that can help businesses collect, extract, understand, and use data for rapid growth.
According to Gartner's report published in 2022, 70% organisations track the quality of data at different levels, which reduced their operational risks and costs by 60%.

How to Choose the Right Power BI Consulting Service?
With our ultimate Power BI guide, we hope you've gained better insights and familiar with Power BI's capabilities and how it can help you visualize data accurately to help your business grow and scale quickly.
Microsoft Power BI is the top choice in the market for its flexibility and simplicity. It can help you leverage data-driven decisions in real time.
The user interface is easy, but the implementation isn't. To make Power BI work for you 24X7, you must choose the right Power BI consulting company like Dynamics Square.
We are a certified Microsoft gold partner and a leading Power BI consultant in the UK, working for the last 14+ years to help organisations get data-driven results for high-impact growth.
We have Power BI consultation experts working to successfully implement the solution in various industries, including retail, manufacturing, oil, e-commerce, FMCG, banking, and others.
The right Power BI consulting services understand the operations or processes and reduce the company's efforts in collecting, analysing, and visualising data using automation.
We have sufficient resources, knowledge, and a team of experts to implement, integrate, develop, and customise Power BI with the utmost support to keep it working for you.
If you are still confused about the functionalities and how Power BI can help you consume the data properly, you don't need to worry, as we can resolve all your issues and queries. We are the UK's most trustworthy Microsoft Power BI consulting partner, and we can resolve all your queries to help you understand the need for Power BI for your business growth with proven data.
With a team of over 150+ Microsoft Certified Professionals, we are serving 500+ happy clients across the globe to offer innovative and data-driven solutions.
No matter your organisation's complexity level, our dedicated Power BI consultation service would comprehensively manage the issues and provide you with the best solution.
Conclusion
Microsoft is constantly improving Power BI's features and capabilities to make it more compatible with the release of new updates such as conditional formatting for data labels and DAX editor upgrades.
Power BI will assist businesses in simplifying difficult data, analyzing large amounts of data with ease, and providing users with accurate visualisation, making the entire data utilization process simple.
We hope you enjoyed this comprehensive Power BI guide for SMBs. Please contact us if you have any further questions or issues concerning Power BI implementation or support. Our certified Microsoft consultants are there to help you 24X7.