Power BI Feature Updates: It Became More Smooth and Powerful
Microsoft keeps updating Power BI features and capabilities to align with the changing needs of growing businesses. Due to the digitalization of a business, the amount of data is increasing, as are the complexities of proper management and utilisation.
Microsoft understands the changing needs and is taking the necessary measures to deal with business modernization. Leveraging the power of technology and automation, Microsoft is working hard to make its products more powerful and business-centric.
Recently, in September 2023, Microsoft released the latest Power BI feature updates to increase data analysis and visualisation capabilities.
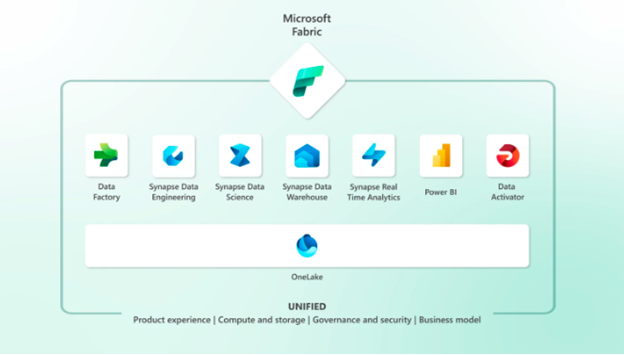
Also, Microsoft has introduced a new product, Microsoft Fabric, a unified data analysis tool capable of integrating different technologies to bring all the data together.
When we talk about Power BI, Microsoft has released a lot of features that can empower you to create strong data analysis and boost your ability to create more visually appealing reports.
Top Power BI Features You Cannot Miss to Read
Microsoft has released Power BI features in certain categories. Among various features, the important ones are given below:
1. Special Announcement for Microsoft Fabric
- Power BI Direct Lake mode in Public Preview
- The Optimise Tab in Power BI Desktop is Generally Available
- Azure Log Analytics for Power BI Datasets is now Generally Available
- Automation with Rest APIs
- Power BI free User Licence Renamed
2. Reporting
- Azure Maps is now Generally Available
- Power BI Desktop has OneDrive and SharePoint Integration
- Set Query Limits in Power BI Desktop
3. Modelling
- New DAX functions: MATCHBY
4. Data Connectivity
- New Connectors were released.
- On-premises Data Gateway 2023 Release
- Different Connector Updates
- Service Updates
- Paginated Reports
- Updated Visualisations
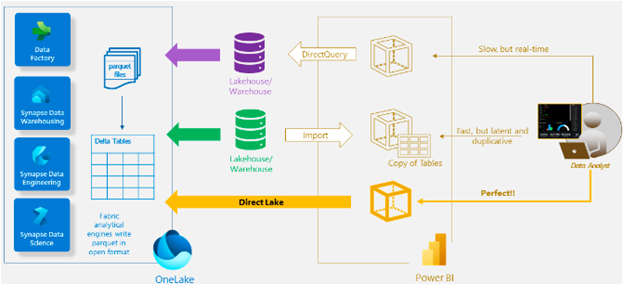
Announcement: Power BI Direct Lake mode in Public Preview
Currently, the dataset users have to choose between Import mode or DirectQuery mode to access the data.
The Import mode offers fast performance, but users have to refresh the data each time a new addition occurs. Whereas there is no need to refresh the data in DirectQuery mode, you need to deal with slow performance.
Power BI Direct Lake mode combines the power of both options to offer high Power BI performance without the need for copying or refreshing the data. Currently, Power BI Direct Lake Mode is available for public preview and can be accessed through Fabric Lakehouse.
Announcement: Optimise Tab in Power BI Desktop is now Available
Now, you will get to see the Optimise Tab in Power BI Desktop. The tools available in this tab will help you enhance your report-building experience.
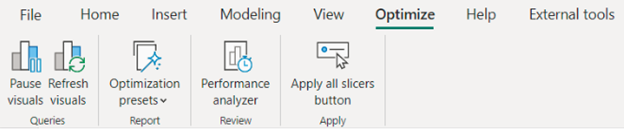
Pause Visuals: When you are making changes while designing a report, it will stop visuals from sending queries.
Optimisation Presets: With the optimisation presets tool, you can easily switch between different report settings that balance Query Reduction and interactions for your visuals.
Generally, it is helpful for big models and Direct Query reports that need precise tuning of performance and user experience.
Apply all Slicers Button: When this button is added to a report, it stops the Slicer from applying the selections. It reduces the number of visual refreshes while users make selections across different slicers.
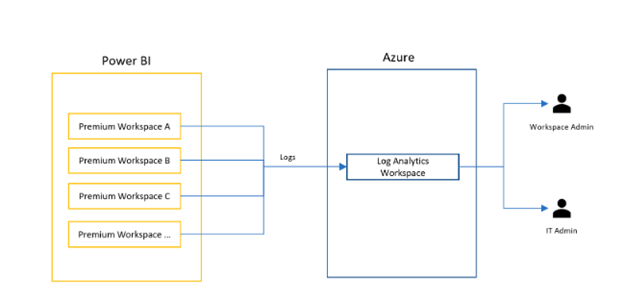
Announcement: Azure Log Analytics for Power BI Datasets is now Generally Available
The Power BI integration with Azure Log Analytics is now available to the public. It is a useful feature for admin users, as they can now analyse the activity and diagnosis of datasets. Earlier, users had to create a new log analytics workspace for each Power BI workspace.
With this update, users can easily connect multiple Power BI workspaces to a single log analytics workspace.
Announcement: Automation with Rest APIs
With the UpdateGroup Admin Rest API, admin users can now automate linking the Log Analytics workspace and Power BI workspace. This feature update is generally useful for large organisations that create new workspaces more often.
Announcement: Power BI Free User License Renamed
The Power BI Free user licence is now called the Microsoft Fabric Free user licence. There are no new changes in functionality, as Microsoft has done this to highlight Microsoft Fabric for the Power BI audience.
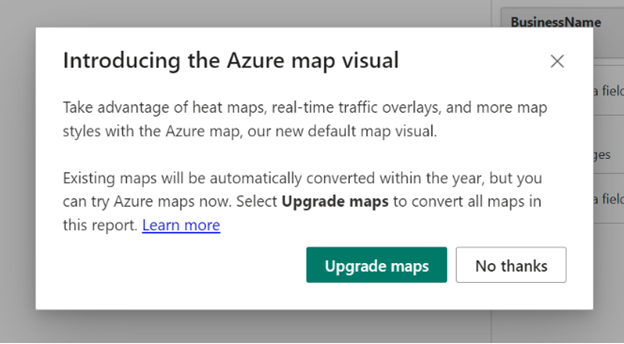
Reporting: Azure Maps is now Available for General Public
Azure Maps is now available to the public. You will be able to avail powerful customization features with existing Map visuals, like location name fields, filled map layers, pie chart layers, and more.
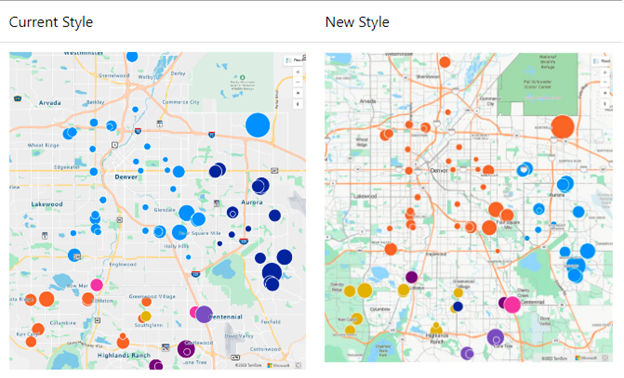
Whenever you open the report with the existing Map Visual, Power BI will ask you to upgrade your map to an Azure map.
Once you upgrade your map, you will see a similar map, as shown in the below image.
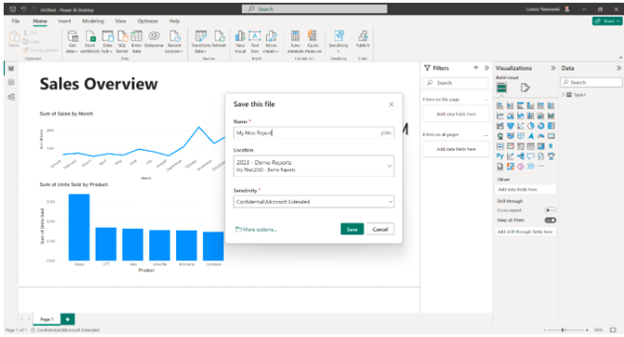
Reporting: Power BI Desktop has OneDrive and SharePoint Integration
When you start working with OneDrive and SharePoint document libraries, you will find three more new options: open, Share, and Save.
Generally, users save the reports using OneDrive and SharePoint so that they can access them from anywhere and anytime. Now, such users would be able to check file versions, collaborate with other users, and create or get backup files whenever required.
You can access these features by clicking on Preview Features in the Options section.
When you enable the feature, you will see the OneDrive and SharePoint folders along with local folders to save a file.
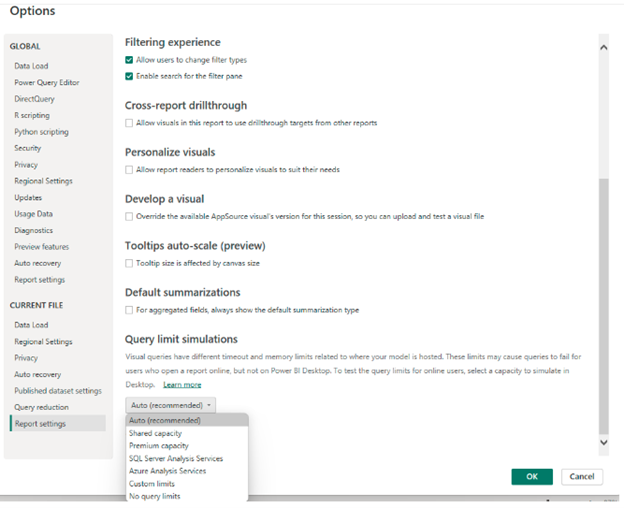
Reporting: Set Query Limits in Power BI Desktop
Based on the Power BI licence, there must be a limited amount of memory and processing power you can use to perform different processes, regardless of your deployment options.
However, Power BI Desktop doesn’t have such limited processing power. But, whenever you share a report with a licenced user of the Power BI Service, you will see an error related to query limits.
With this update, you will be able to justify the query limits in Power BI Desktop so that you can match the limit with Power BI Service users.
- To do so, open the options settings and click on the Report setting.
- Now, click on the No Query Limit drop-down and select the Auto (recommended) option.
- Also, you can set the custom limit by justifying the values in Memory Limit (KB) and Timeout Limit (Seconds).
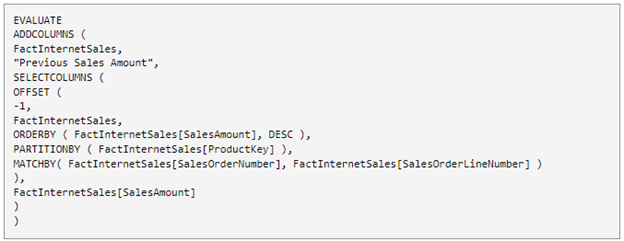
Modeling: New DAX functions: MATCHBY
This function is new, and it specifies the columns that are used to match data and identify the current row when used in any window function.
For instance, check out the below query that shows Fact Internet Sales whenever we add a new column. Each action indicates each sale; the prior sales amount was in descending order of sales from the same product.
Data Connectivity: New Connectors Released
Microsoft has released various new connectors to start accepting data from diverse resources.
• MongoDB Atlas
It allows Power BI to fetch and analyse data stored in MongoDB Atlas. With this integration, you will be able to start the querying process using SQL without defining a schema.
• Celonis EMS
This connector allows users to connect Power BI with a Celonis EMS instance using the Team URL. This integration enhances the overall reporting while also offering powerful insights.
• CloudBlue PSA
This connector connects CloudBlue PSA with Power BI. To your knowledge, it is a cloud-based professional services automation solution that simplifies the needs of MSPs.
• SolarWinds Service Desk
It allows Power BI to establish a connection with SolarWinds Service desk system. After the integration, Power BI will be able to fetch the data based on incidents occurring on the SolarWinds system.
• Wrike
This connection will allow Power BI to directly fetch the data from the Wrike account. It lets Power BI get the data directly from different objects, including Tasks, Projects, Finance Fields, Job Roles, and Contacts.
Data Connectivity: On-premises Data Gateway 2023 Release
Microsoft has released an On-premises Data Gateway for Standard and Personal modes. With this update, whenever you publish a report, it will follow the same gateway through the same query execution logic.
Data Connectivity: Different Connector Updates
Along with the addition of new connectors, Microsoft has updated a few of the existing connectors too.
- Anaplan
- AssembleViews
- Autodesk Construction Cloud
- Azure Databricks
- BitSight Security Ratings
- BQE Core
- Funnel
Data Connectivity: Service Updates
A few of the service updates are:
Microsoft has announced its Data Loss Prevention policy is now available to the public. This policy will help organisations protect sensitive information. After this policy, Power BI with DLP policy will automatically detect sensitive information that may be shared in the wrong workspace by any user.
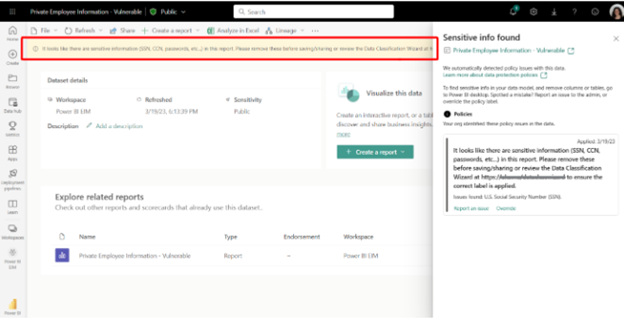
The sensitive information will be detected using:
- Custom Keywords
- Complex Conditions
- Alerts
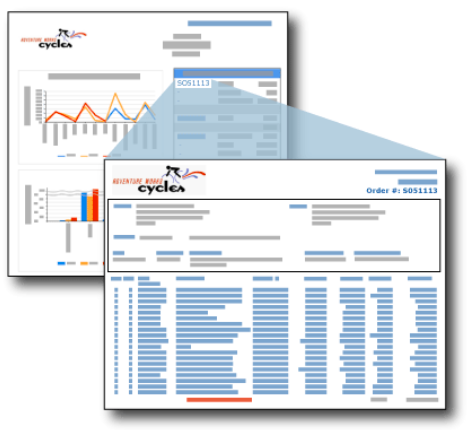
Data Connectivity: Paginated Reports
Microsoft has added drillthrough reports to paginated reports in the Power BI Service. From now on, you will be able to avail of the capabilities of on-premises drill through with the Power BI Service.
A drillthrough report opens when a user clicks on a link available in another paginated report. It mostly contains the data about an item that is contained in the original summary report.
Data Connectivity: Updated Visualisations
Microsoft has added new visualisations to Power BI. Some of them are available below:
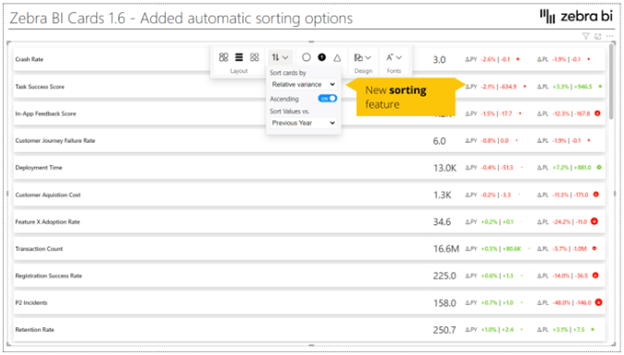
• Zebra BI Cards 1.6
This will empower you to build your KPI reporting more comprehensively. It highlights big numbers and special cards so that you can understand a report better. With this, you will be able to:
- Sort data by different criteria
- Highlight specific KPIs
- Show different BANs
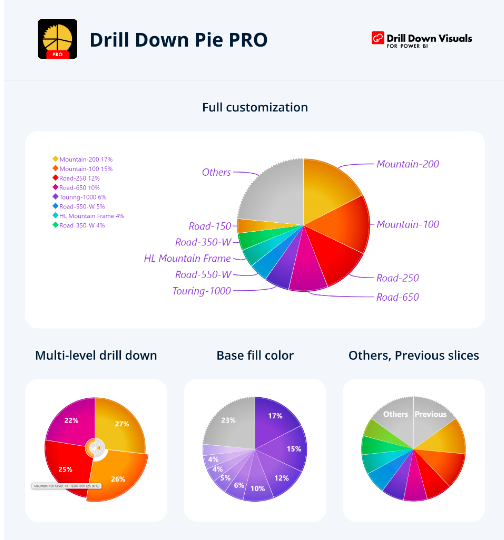
• Build Pie Chart with Drill Down Pie Pro
You can use Drill Down Pie Pro to create stunning and visually appealing pie charts to promote proper data visualisation and analysis. Also, you can interact with the pie chart using a cursor or mouse.
• Acterys Gantt
It empowers Power BI to enable complete project management functionality. Also, it supports editing tasks and adding examples to visuals. Using Gantt, you can view different tasks on multiple levels of hierarchy.

• Strip Plot by Nova Silva
Sometimes, a chart hides or summarises the data, leaving important details hidden. In such a scenario, the refined data is unable to show an accurate visualisation.
To deal with such issues, the Strip Plot shows accurate data observations using all data points on a single continuous scale.
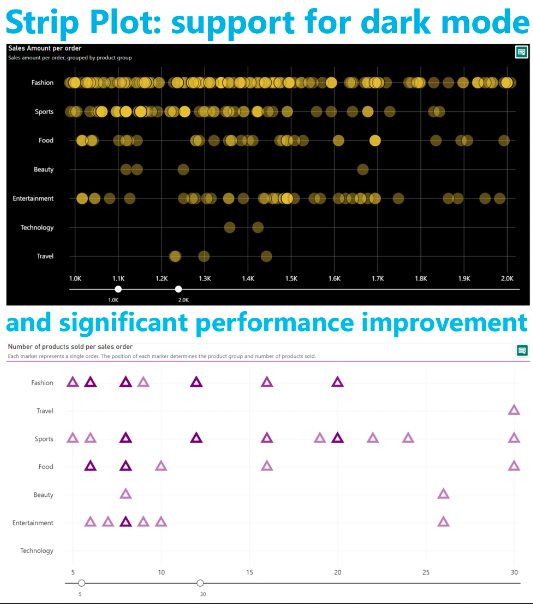
Microsoft has updated the capabilities of Strip Plot, and now it can show up to 30,000 markers in a single visual.
• TMap 2.0
Microsoft has added two new maps to TMap 2.0:
Stacked Bar Chart Map: You can use it to view trends in data across multiple geographical regions.
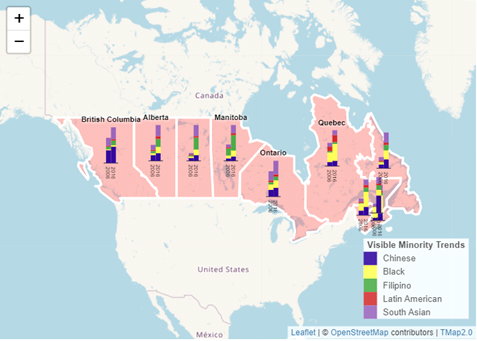
Donut Chart Map: When you change the level of zoom on the above chart, you will get the polygon layer.

To try these features, go to Microsoft AppSource and download it.
• Calendar by MAQ Software (Updated)
MAQ Software has updated its calendar with more features and functions to offer a better user experience. Now, you can easily track all events directly in Power BI with an interactive calendar visual.

Summing Up:
Power BI has been updated with a lot of features that can make your processes of data analysis and visualisation a lot smoother and simpler. Irrespective of your business type, you can try out the Microsoft Power UI to understand and utilise the data so that you can proceed on the path of sustainable growth.
In case you are facing any kind of issue with Power BI or have a query related to any of its aspects, feel free to contact Dynamics Square, a Microsoft-certified Power BI implementation partner. Also, you can call us directly at +44-207-193-2502 or write a mail to info@dynamicssquare.co.uk. Our certified team of Microsoft consultants is waiting for your call.

Vivek is a Digital marketing expert at Dynamics Square, specializing in crafting compelling content on advanced tech topics such as ERP, CRM, cloud computing, AI, ML, BI and more. His profound passion for the digital landscape has led him to explore and master diverse fields including SEO, SEM, content strategy, and data-driven marketing.